50,000 Online Learners: Two Courses, Same Numbers, Different Royalties
Two of my LinkedIn Learning courses have crossed the 50,000 learner milestone.
What makes this interesting is that one course generated almost 4x the cumulative royalties of the other and more than 7x the average monthly payout, despite both reaching virtually the same learner count.
Learner count is one of the most visible metrics available to course creators, so it is easy to assume that courses with similar learner numbers perform similarly. This comparison shows why that assumption can be misleading.
I am usually curious about milestone numbers: how long it takes people to reach them, what happens after they reach them, and what the numbers actually mean underneath the celebration. When I search for this kind of thing online and do not find many real examples, I try to write about my own data.
This is also a celebration. It is pretty cool to live in the reality of something you once only read about. One course crossing 50,000 learners felt special. Seeing it happen again makes it even more interesting, because it suggests that at least part of the pattern is reproducible.
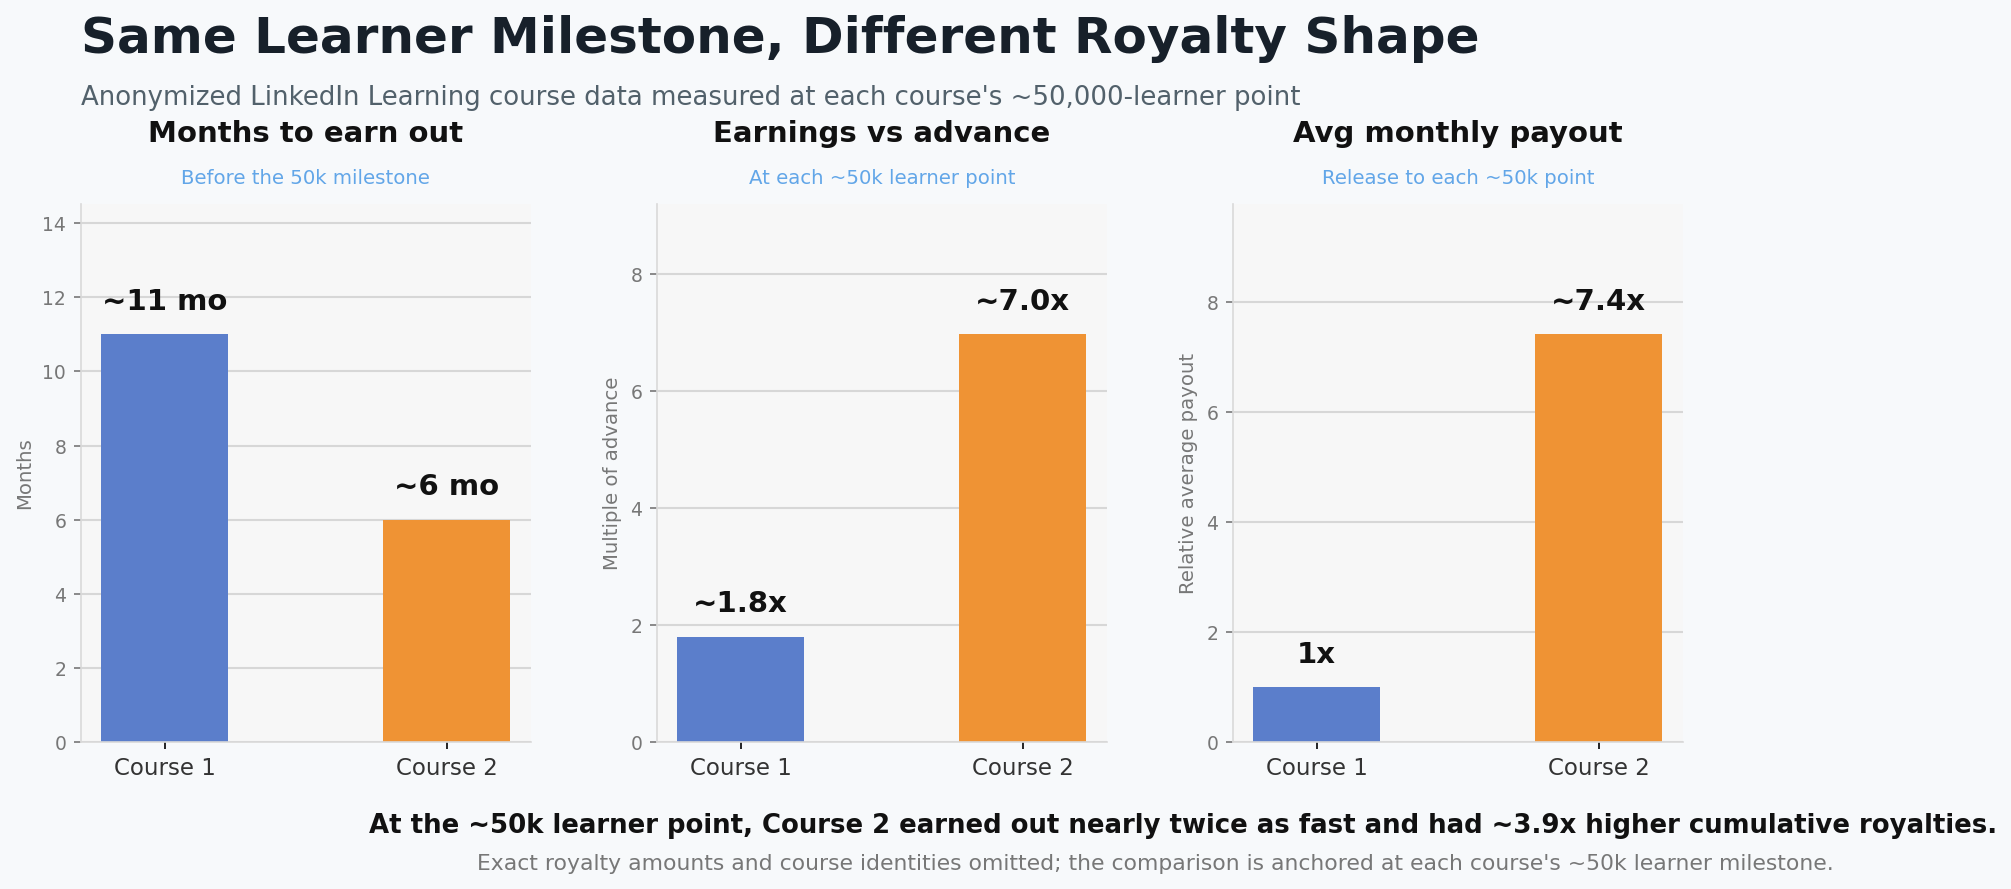
Figure: Same learner milestone, different royalty shape. Anonymized data measured at each course's approximately 50,000-learner point.
I previously wrote about two courses with similar royalties but very different learner numbers: Online Course Revenue: Two Courses, Different Numbers, Similar Royalties.
This time, I want to look at the opposite pattern: similar learner numbers, different royalties.
The data comes from my LinkedIn Learning courses. I will not be sharing exact royalty amounts or course identities. The point is to show the shape of the data: learner count, timing, earn-out speed, royalty ratios, and what these numbers suggest.
You can explore my full course catalogue here: wuraolaoyewusi.com/#courses.
A Bit of Context
I create courses in AI, data science, Python, and healthcare analytics on LinkedIn Learning.
Learner count is the most visible number, so it is easy to treat it as the main measure of success. But course royalties are not calculated by learner count alone. They are shaped by watch time, topic demand, timing, course length, platform behaviour, and how useful the course is to paying subscribers.
That is why two courses can reach the same learner milestone and still tell very different financial stories.
The Two Courses
Data note: Course 1 uses its February 2026 values at about 49,991 learners. Course 2 uses its April 2026 values at about 49,989 learners. Earn-out timing comes from the earn-out tracking sheet. Average monthly payout is calculated as post-advance payout divided by the reporting months from release to each course's ~50k learner point.
One coincidence I found interesting is that both courses took about 22 months to reach this ~50,000-learner point. I do not think that means 22 months is how long it generally takes a course to reach 50,000 learners. These are just two courses, with their own topics, timing, and platform context. But the similar time-to-milestone makes the royalty difference even more interesting to compare.
| Metric | Course 1 | Course 2 |
|---|---|---|
| Learner count at comparison point | ~49,991 | ~49,989 |
| Earn-out timeline | 47.2 weeks (~11 months) | 25.4 weeks (~6 months) |
| Learners at earn-out | ~34,400 | ~10,100 |
| Cumulative royalties at ~50k learners | 1x baseline | ~3.9x Course 1 |
| Average monthly payout at ~50k learners | 1x baseline | ~7.4x Course 1 |
The headline result: at almost identical learner counts, Course 2 earned out nearly twice as fast, generated roughly 3.9x the cumulative royalties, and produced about 7.4x the average monthly payout.
What the Numbers Reveal
1. Same Learner Count Does Not Mean Same Royalties
For this comparison, I am using both courses at almost the same learner count: Course 1 at about 49,991 learners and Course 2 at about 49,989 learners.
That gives a cleaner baseline. We are looking at what was happening for both courses when they were at the same milestone.
On the surface, both are large learner milestones. But the royalties tell a very different story. Course 2 had earned roughly 3.9x more cumulatively at the same learner count.
2. Earn-Out Speed Still Matters
Course 1 took 47.2 weeks, about 11 months, to earn out its advance, with roughly 34,400 learners at that point.
Course 2 took 25.4 weeks, about 6 months, to earn out its advance, with roughly 10,100 learners.
That difference is striking. Course 2 did not need anything close to the same learner count to cross the same advance threshold. This suggests that earn-out speed is not just about learner volume. It is also about revenue quality per learner.
3. The Average Payout Pattern Was Very Different
Instead of comparing one single month, I am comparing average monthly payout up to each course's 50,000-learner point.
For this, I use post-advance payout divided by the number of reporting months from release to the milestone. That means the early zero-payout months before earn-out are included in the average.
Using that baseline, Course 2 produced about 7.4x the average monthly payout of Course 1 by the time both courses were at roughly 50,000 learners.
4. The Same Milestone Can Hide Different Business Behaviour
This is the part I find most useful: the same learner milestone can hide very different revenue behaviour.
My best guess is that earnings per learner is shaped by factors that learner count cannot capture: how deeply subscribers engage with a course, where it lands in the platform cycle, and whether the topic aligns with what paying subscribers are actively seeking at that moment.
Course 2 seems to have had a more favourable combination of those factors. I cannot point to one single cause, but the pattern suggests that two courses can be equally visible and still generate very different economic value from each viewer.
One way to think about this is that learner volume and revenue efficiency are different dimensions of course performance. Learner count tells us how many people reached the course. Earnings per learner tells us something about the economic value created by that engagement.
That does not make one course better than the other. It just means learner count is one layer of the story, not the whole story.
I wrote more generally about earn-out timelines here: How Long Until You Earn Out a Royalty Advance? Here's Some Real Data.
5. A Big Learner Count Is Still Worth Celebrating
Even though this post is about the limits of learner count as a metric, I do not want to dismiss it.
A course crossing 50,000 learners is a real milestone. It means the course has reached a large number of people. It means the work travelled. It means people found it, opened it, and spent some amount of time with it.
That matters.
But for creators trying to understand the business side, the lesson is that learner count is only one layer. Royalties add another layer. Earn-out timing adds another. Average payout behaviour adds another.
The Takeaway
The biggest lesson for me is that visible numbers are useful, but incomplete.
Two courses can reach almost exactly the same learner milestone and still behave very differently financially. One can be a steady long-tail performer. Another can become a higher-velocity earner because the topic, timing, and engagement pattern align differently.
For me, this is both a milestone post and a data post.
Two courses. Same learner baseline. Different royalties. Different paths. The visible milestone was the same, but the business story underneath it was not. That is the part worth paying attention to, and I am glad that I get to experience and share my findings and patterns so far. I am looking forward to experiencing the milestone of 100k learners in a single course. That will be fun.